Comparing Embedding Models for a Knowledge Graph (Part A: The 56-Entry Test)
What We’re Trying to Do
The project has 16,282 “Words of Brandon” (WoB) Q&A entries from fan events. Each entry was hand-tagged on Arcanum (a community wiki) with entity names like “kaladin”, “allomancy”, “roshar”. But tagging is inconsistent — many entries discuss an entity without being tagged with it, and some entity names are common English words (“rock”, “honor”, “ruin”) that create false matches when you try to find them with text search.
We want to use embedding models to solve both problems: discover missing connections AND avoid false matches. The question is: which embedding model does this best?
This is Part A of two posts. Here we design three hand-crafted tests and pick a winner. In Part B, we’ll question whether 56 labels were enough — and build a cross-validation framework on all 7,813 tagged entries that tells a different story.
How the Test Is Set Up
Step 1: Embed every entry (04_embed_entries.py)
Each of the 16,282 entries gets sent to an embedding API. The model reads the text and returns a vector — a list of numbers (e.g., 3072 numbers for Azure OpenAI, 1024 for Voyage). Entries that discuss similar topics will have vectors that point in similar directions.
We tested 4 models:
| Model | Dimensions | Notes |
|---|---|---|
Azure OpenAI text-embedding-3-large | 3072 | Microsoft-hosted OpenAI model, largest general-purpose |
Azure Cohere embed-v4 | 1024 | Cohere’s latest, strong on multilingual |
Google Gemini embedding-001 | 3072 | Google’s embedding model |
Voyage voyage-4 | 1024 | Specialist retrieval model, often tops benchmarks |
All 16K entries were embedded with each model. The results are cached as .npy files (numpy arrays) so this only needs to happen once.
Step 2: Build entity reference vectors
For each of the 622 entity tags (excluding meta/book types), the script collects all entries that Arcanum curators explicitly tagged with that entity. It requires at least 5 such entries (to avoid noisy references). It then averages those entry embeddings into a single reference vector per entity.
This gives us 367 entity reference vectors — the “semantic fingerprint” of what discussions about each entity look like. The averaging is done after L2-normalization, so each reference vector represents the centroid of its tagged entries in the embedding space.
Why average? Think of it geometrically. Each entry embedding is a point on a high-dimensional sphere (after L2 normalization). All the entries tagged “kaladin” form a cluster on that sphere. The average of those points gives you the center of that cluster — the direction in embedding space that most represents “Kaladin-ness.” When we later ask “is this new entry about Kaladin?”, we measure how close it is to that center.
The 5-entry minimum matters because with fewer points, your “center” could be dominated by one unusual entry. With 5+, the average is more stable.
Step 3: Compute the similarity matrix
For each model, we compute a giant matrix of shape (16,282 entries x 367 entities). Each cell is the cosine similarity between an entry’s embedding and an entity’s reference vector. Cosine similarity ranges from -1 to 1, where 1 means the vectors point in exactly the same direction (maximally similar) and 0 means they’re orthogonal (unrelated).
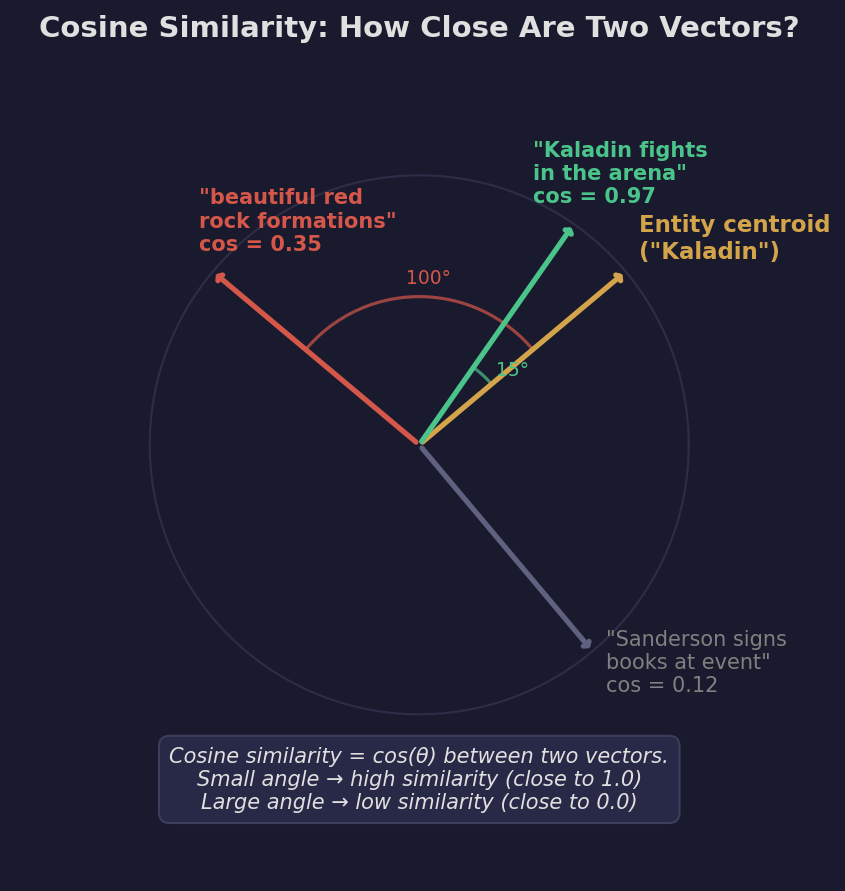
In practice, most values fall between 0.3 and 0.95. The question is: above what threshold should we say “this entry is about this entity”?
Test 1: Disambiguation Accuracy
What it measures
Can the model tell the difference between the Cosmere entity and the common English word?
The ground truth
We hand-labeled 56 WoB entries across 9 deliberately ambiguous entities:
| Entity | Cosmere meaning | Common English meaning | Examples |
|---|---|---|---|
| rock | Horneater character from Bridge Four | geological material | ”How would you pronounce Rock’s full name?” vs. “beautiful red rock formations” |
| honor | A Shard (divine entity) of Roshar | the English concept of honor | ”Could Honor and Autonomy be considered opposites” vs. “it has been an honor” |
| lift | Young Edgedancer character | the verb “to lift" | "Is Lift one-of-a-kind?” vs. “strong enough to lift” |
| ruin | A Shard of Scadrial | to destroy/spoil | ”Can Odium influence people the same way Ruin can?” vs. “I don’t wanna ruin The Emperor’s Soul” |
| stick | A famously stubborn stick from Shallan’s Soulcasting scene | a common object | ”What is Stick’s telos?” vs. “If you drew a stick figure” |
| marsh | Kelsier’s brother, an Inquisitor | wetland (though this usage didn’t appear) | “Where’s Marsh?” / “Is Marsh happy?“ |
| focus | A Cosmere-specific magic system concept | the English verb “to focus" | "What is the definition of a focus (in the Ars Arcanum)?” vs. “I generally focus on one character” |
| color | A magic system mechanic (BioChromatic Breath) | physical color | ”when the color’s pulled out of something” vs. “Skin color is a terrible reason to judge someone” |
| spook | Mistborn character | the verb “to spook/frighten" | "Was Spook still alive when…” vs. “something he does spooked her” |
Each label says: this specific entry either is or is not about the Cosmere entity.
How the test works
For each entry in the ground truth, the script looks up its cosine similarity to the entity’s reference vector. If the similarity is above a threshold, it predicts “yes, this entry is about the entity.” Then it compares that prediction to the hand label.
The metrics: Precision, Recall, and F1
These are the three standard metrics for binary classification:
Precision = “Of all the entries the model said were about the entity, how many actually were?”
Precision = True Positives / (True Positives + False Positives)A precision of 1.00 means: every time the model said “this is about Rock the character,” it was right. No false alarms. But it might have missed some genuine entries.
Recall = “Of all the entries that actually are about the entity, how many did the model find?”
Recall = True Positives / (True Positives + False Negatives)A recall of 1.00 means: the model found every single entry about Rock. But it might have also incorrectly flagged some non-Rock entries.
F1 = The harmonic mean of precision and recall. It balances both:
F1 = 2 * (Precision * Recall) / (Precision + Recall)F1 = 1.00 is perfect. F1 = 0 means total failure. The harmonic mean (rather than arithmetic mean) penalizes models that sacrifice one metric for the other — you can’t get a high F1 by having 100% recall but 10% precision.
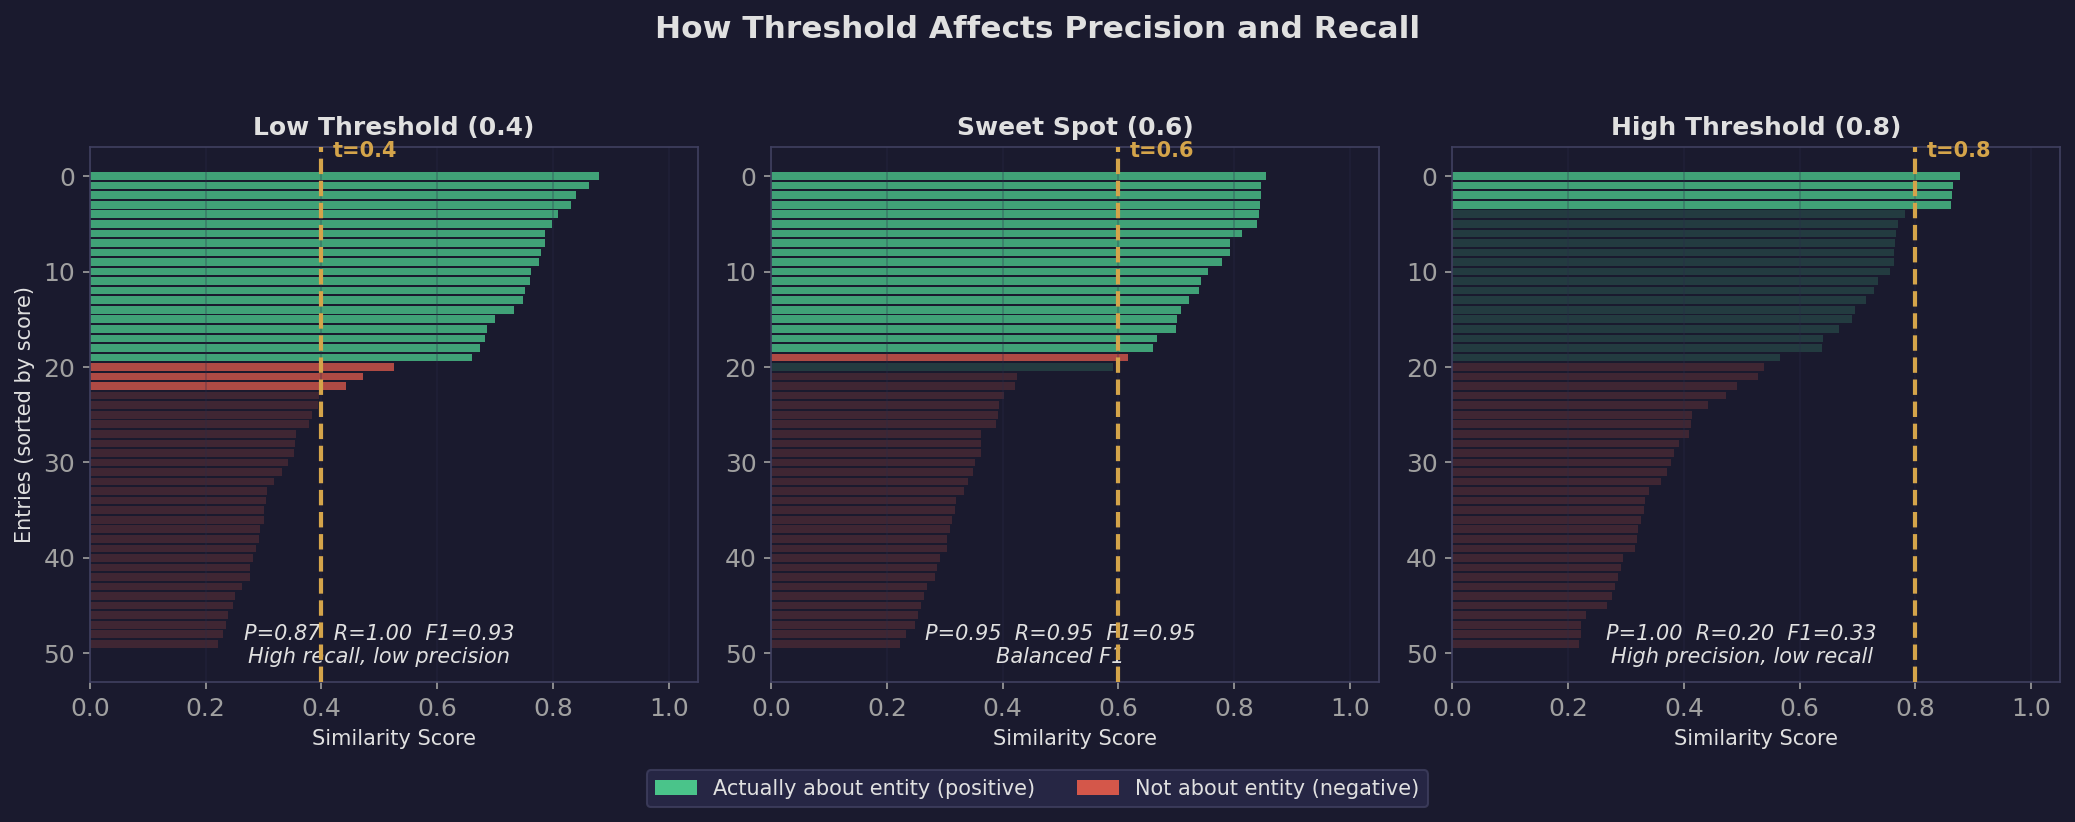
Why the threshold matters so much. A low threshold (0.4) means “accept anything even vaguely similar” — high recall (you catch everything) but low precision (lots of false positives). A high threshold (0.8) means “only accept very confident matches” — high precision (few mistakes) but low recall (you miss a lot). The ideal threshold sits in the sweet spot where F1 peaks.
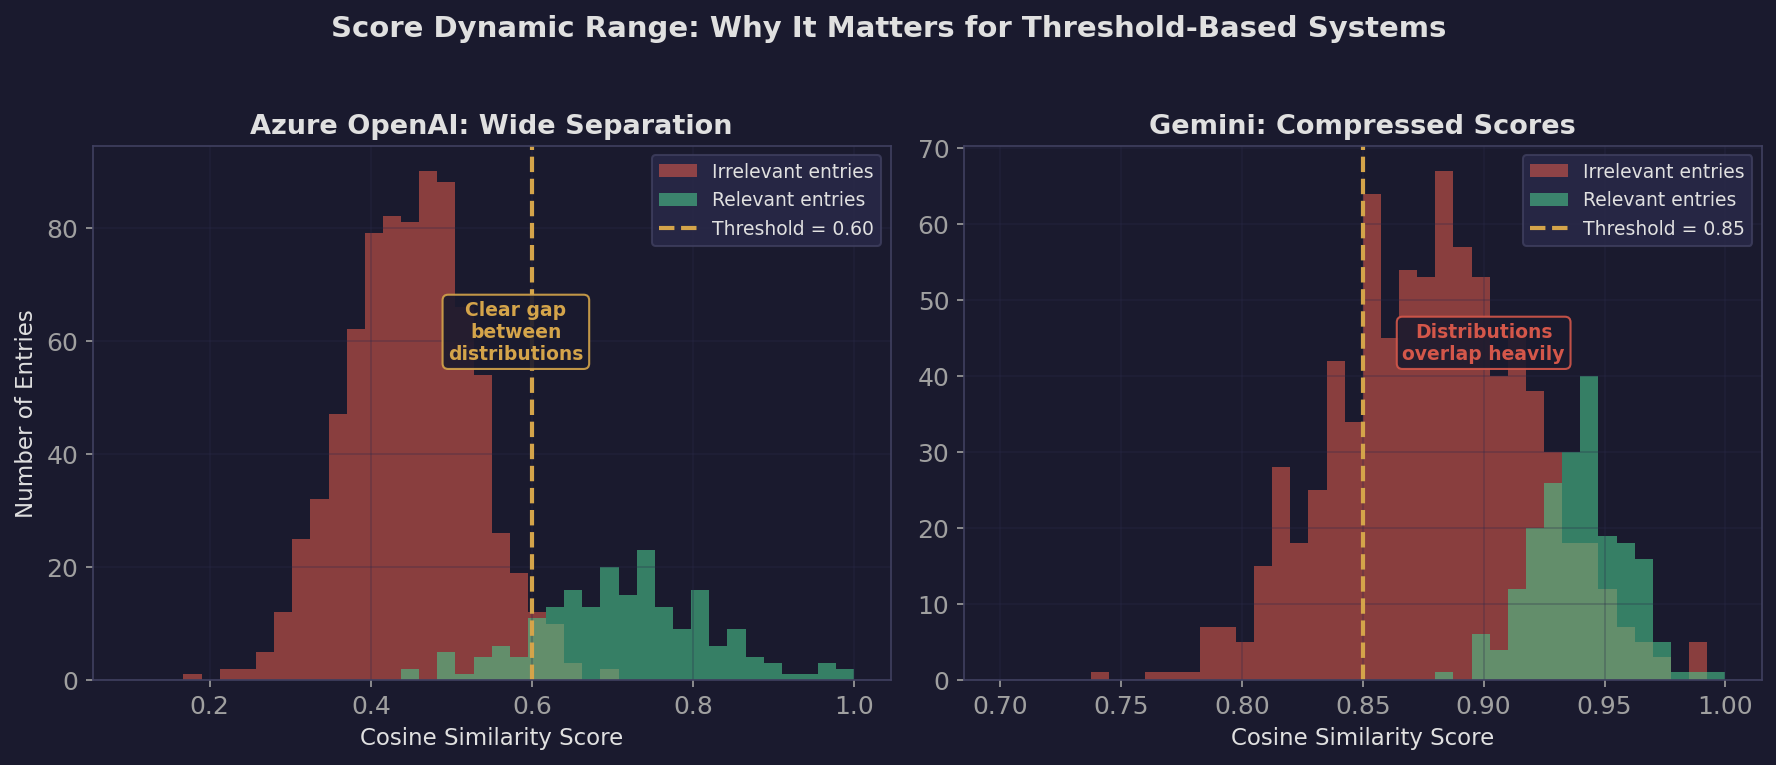
Different models peak at different thresholds because their similarity distributions are different. Azure OpenAI might produce scores of 0.6-0.8 for relevant entries, while Gemini might produce 0.85-0.97 for the same entries. The threshold is not comparable across models — it’s model-specific.
What we learned
Threshold sweep results (overall F1):
| Threshold | Azure OpenAI | Azure Cohere | Gemini | Voyage |
|---|---|---|---|---|
| 0.40 | 0.77 | 0.78 | 0.72 | 0.81 |
| 0.50 | 0.86 | 0.90 | 0.72 | 0.85 |
| 0.55 | 0.90 | 0.93 | 0.72 | 0.83 |
| 0.60 | 0.93 | 0.88 | 0.72 | 0.70 |
| 0.65 | 0.78 | 0.76 | 0.72 | 0.56 |
| 0.70 | 0.71 | 0.65 | 0.78 | 0.58 |
| 0.75 | 0.31 | 0.36 | 0.84 | 0.41 |
| 0.80 | 0.07 | 0.07 | 0.95 | 0.20 |
| 0.85 | 0.07 | — | 0.74 | 0.07 |
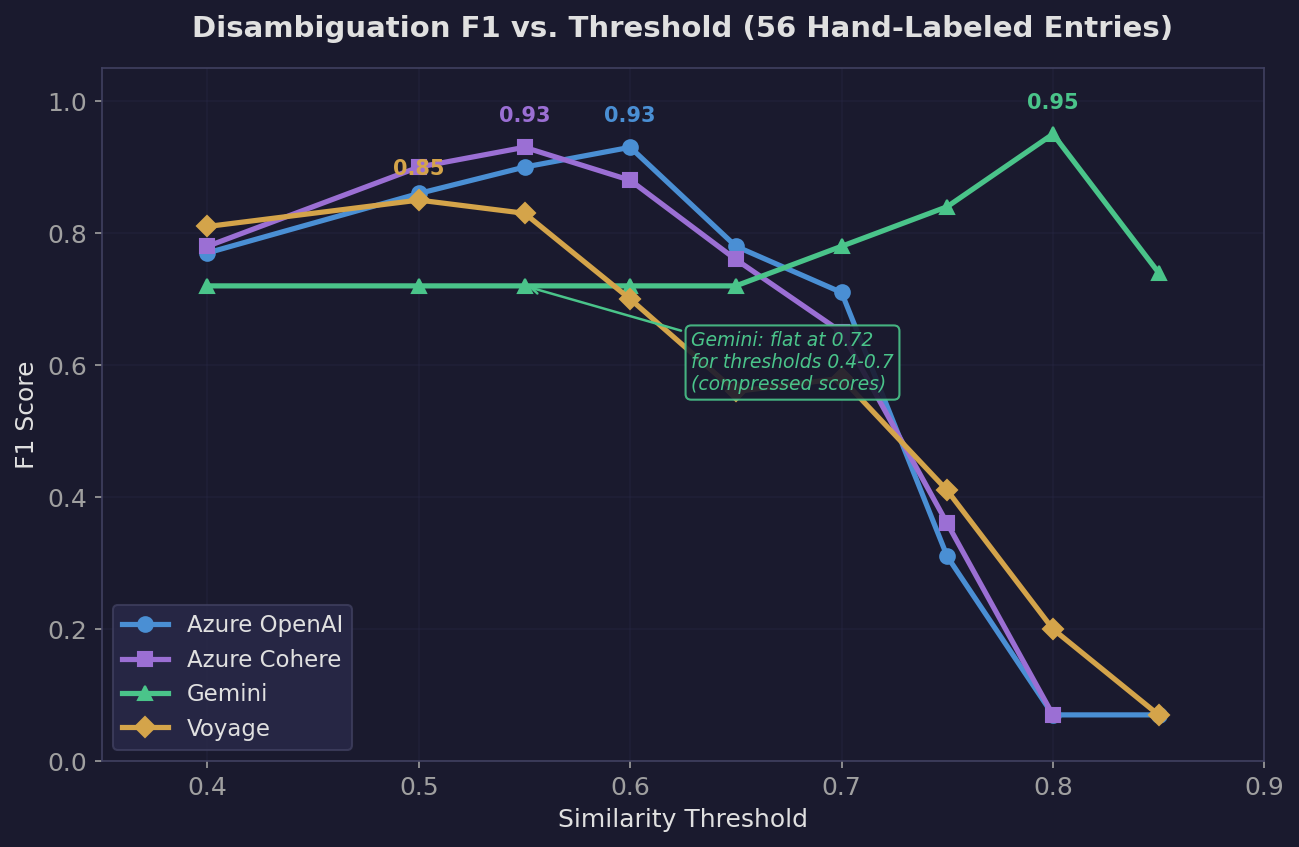
Azure OpenAI: Peaks at F1=0.93 (threshold 0.6). Has a wide useful range — 0.5 through 0.65 are all above 0.78. This means you have room to tune the threshold without destroying performance.
Azure Cohere: Peaks at F1=0.93 (threshold 0.55). Very similar to Azure OpenAI but peaks slightly earlier and drops slightly faster.
Gemini: Flat at 0.72 for thresholds 0.4-0.7, then rises to 0.95 at 0.8. This is bizarre and reveals a fundamental problem. At threshold 0.7, Gemini has recall=1.00 (finds everything) but precision=0.64 (36% of its matches are wrong). The similarity scores are so compressed that even unrelated entries score above 0.7.
Voyage: Peaks at F1=0.85 (threshold 0.5) but drops steeply. By 0.6 it’s already at 0.70. At 0.7, it gets -- (zero recall) for honor, lift, ruin, and marsh — meaning those entities’ true-positive entries all scored below 0.7. Its useful range is narrow: essentially just 0.4-0.5.
What “focus” reveals about the test. Every model scored -- for “focus” — no entity reference embedding was generated because “focus” as a Cosmere concept had fewer than 5 explicitly tagged entries. This is an honest limitation of the test: entities with sparse tagging on Arcanum simply can’t be evaluated. The ground truth has 4 positive and 4 negative examples for “focus,” but without a reference embedding, no model can even attempt it.
What Gemini’s flat F1 reveals. The fact that Gemini’s F1 barely changes from 0.4 to 0.7 means its similarity distribution is extremely compressed. Imagine a model where every entry scores between 0.90 and 0.98 against every entity. Lowering the threshold from 0.7 to 0.4 changes nothing because nothing scored that low to begin with. This makes the model effectively useless for threshold-based systems — you can’t draw a meaningful line between “related” and “unrelated.”
Test 2: Similarity Quality
What it measures
For 10 well-known entities, what are the 5 most similar entities? This is a qualitative “smell test” — do the results make Cosmere sense?
How it works
The script takes each entity’s reference vector and computes cosine similarity against all other entity reference vectors. It ranks them and shows the top 5.
What we learned
Let me walk through a few telling examples:
Hoid (the cosmere’s most connected character — a worldhopper who appears across multiple series):
| Model | Top 5 |
|---|---|
| Azure OpenAI | worldhoppers (0.90), frost (0.85), vasher (0.85), yolish lightweaving (0.85), worldhopping (0.84) |
| Cohere | worldhoppers (0.87), dalinar (0.86), frost (0.86), kaladin (0.85), kelsier (0.85) |
| Gemini | worldhoppers (0.95), frost (0.94), cosmere (0.94), worldhopping (0.94), scadrial (0.93) |
| Voyage | sigzil (0.82), worldhoppers (0.82), frost (0.81), yolish lightweaving (0.81), vasher (0.79) |
Azure OpenAI and Voyage both correctly identify the cosmere-lore connections (Frost, Vasher, Yolish Lightweaving). Voyage uniquely puts Sigzil first — Hoid’s apprentice — which is an impressively specific connection. Cohere pollutes its results with generic main characters (Dalinar, Kaladin, Kelsier) that aren’t especially Hoid-related.
Shallan (Stormlight character, lightweaver, scholar):
| Model | Top 5 |
|---|---|
| Azure OpenAI | jasnah (0.88), dalinar (0.87), kaladin (0.87), knights radiant (0.87), adolin (0.85) |
| Voyage | jasnah (0.84), shashara (0.82), dalinar (0.82), eshonai (0.82), sylphrena (0.82) |
Voyage again surfaces interesting cross-series connections. Shashara (a scholar/lightweaver-analog from Warbreaker) is a deep thematic parallel to Shallan. Eshonai and Sylphrena are also more specific than the generic “dalinar, kaladin” that other models produce.
The dynamic range problem: Look at Gemini’s scores. For Hoid, the top 5 range from 0.93 to 0.95. For Azure OpenAI, they range from 0.84 to 0.90. This matters because in the frontend, users adjust sliders to explore relationships. If everything is 0.93-0.95, the sliders have almost no effect. Azure OpenAI’s wider spread (0.07 gap between #1 and #5 vs Gemini’s 0.02 gap) gives the UI meaningful resolution.
Test 3: Discovery Power
What it measures
If we use this model to implicitly tag all 16K entries (anything above the threshold gets tagged), how many new tags and edges do we discover?
How it works
For every entry, the script checks its similarity to all 367 entities. If the similarity exceeds the threshold AND the entry wasn’t already explicitly tagged with that entity, it counts as a “new implicit tag.” Then it rebuilds the co-occurrence graph (two entities share an edge if they co-occur in the same entry) and measures the resulting connectivity.
What we learned (threshold = 0.7)
| Metric | Azure OpenAI | Azure Cohere | Gemini | Voyage |
|---|---|---|---|---|
| New implicit tags | 15,100 | 4,463 | 4,216,588 | 15,161 |
| Entries newly tagged | 1,688 | 1,242 | 6,875 | 1,848 |
| Total edges | 9,422 | 1,967 | 103,623 | 7,122 |
| Isolated nodes | 218 | 242 | 109 | 226 |
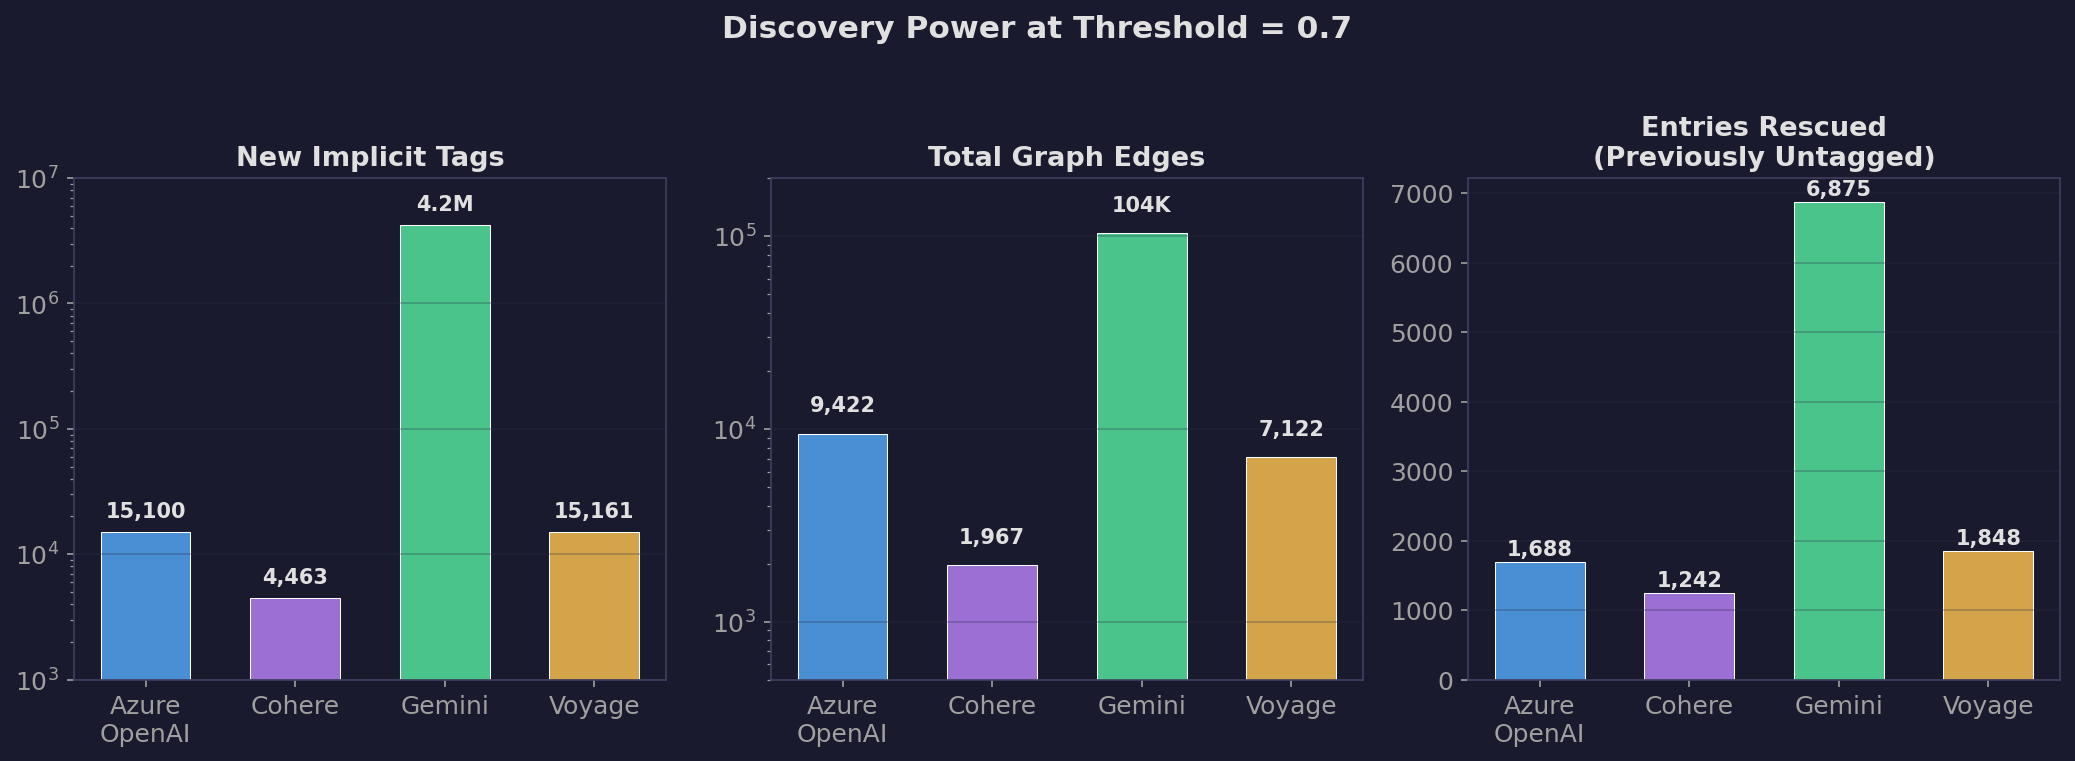
Gemini generated 4.2 million implicit tags. That’s roughly 16K entries x 260 entities each — it tagged nearly every entry with nearly every entity. Its top entities each got ~14,500 additions out of 16,282 total entries. That’s not discovery, that’s a model saying “everything is related to everything.” The 103K edges it produced would turn the graph into an unreadable hairball.
Azure OpenAI and Voyage produced very similar numbers of implicit tags (~15K). But Azure OpenAI created more edges (9,422 vs 7,122) and fewer isolated nodes (218 vs 226), meaning it produces a more connected graph.
Azure Cohere was the most conservative — only 4,463 new tags and 1,967 edges. It barely extends the graph.
The “top entities” lists reveal model personality:
Azure OpenAI’s top implicit tags are broad cosmere concepts: “cosmere sequence” (+435), “realmatic theory” (+364), “investiture” (+303). These are reasonable — many WoB entries discuss cosmere mechanics without being explicitly tagged.
Voyage’s list is similar but heavier on meta-concepts: “cosmere sequence” (+970), “conflux novels” (+564). The “conflux novels” result is concerning — that’s a meta tag, not a true semantic connection.
Gemini’s list is nonsensical: “taldain” (+14,824), “nalthis” (+14,796). It tagged nearly every entry with nearly every world name.
Discovery Power reveals the “Goldilocks zone” problem. Too few implicit tags (Cohere: 4K) means you’re barely improving over explicit tags alone. Too many (Gemini: 4.2M) means you’ve drowned the signal in noise. The right model finds a middle ground where the new connections are genuinely useful — not so aggressive that “Paalm” gets tagged on 14,466 entries (Gemini), but aggressive enough to rescue isolated nodes.
The “entries newly tagged” metric is particularly telling. These are entries that had ZERO explicit tags and got assigned to an entity purely via embedding similarity. Azure OpenAI rescued 1,688 and Voyage rescued 1,848 of these orphans. But Gemini “rescued” 6,875 — by indiscriminately tagging everything.
Summary: Why Azure OpenAI Won
| Criterion | Azure OpenAI | Cohere | Gemini | Voyage |
|---|---|---|---|---|
| Peak F1 | 0.93 | 0.93 | 0.95* | 0.85 |
| Usable threshold range | 0.50 - 0.65 | 0.50 - 0.60 | 0.75 - 0.85 | 0.40 - 0.50 |
| Score dynamic range | Wide | Medium | Very narrow | Medium |
| Discovery (new tags) | 15,100 | 4,463 | 4,216,588 | 15,161 |
| Graph edges | 9,422 | 1,967 | 103,623 | 7,122 |
| Similarity quality | Good | Generic | Good but compressed | Best (cross-series) |
*Gemini’s F1=0.95 is at threshold 0.8, where it still produces 4M+ false tags.
Azure OpenAI is the best all-around choice for this project because:
- It has the highest F1 at a practical threshold (0.93 at 0.60)
- Its wide usable threshold range (0.50-0.65) gives the frontend sliders room to work
- Its wider score distribution means slider adjustments produce visible changes in the graph
- It generates the most graph edges (9,422) without generating noise
- Its similarity rankings are sensible (not as surprising as Voyage’s, but reliable)
Voyage is genuinely impressive for qualitative similarity (Sigzil for Hoid, Shashara for Shallan) but its narrow usable threshold range makes it a poor fit for a system where users control the threshold via sliders.
Cohere is too conservative — it barely extends the graph beyond explicit tags.
Gemini has a fundamentally compressed similarity space that makes it unsuitable for threshold-based classification at any practical threshold.
But is this the full story? We evaluated on 56 hand-labeled entries across 9 entities — 0.3% of our data, and specifically the hardest 0.3%. In Part B, we build a proper cross-validation framework on all 7,813 tagged entries and discover that the rankings change completely.