I Ran 190 A/B Tests to See if MCP Tools Waste Tokens
I Ran 190 A/B Tests to See if MCP Tools Waste Tokens
I thought MCP’s JSON-RPC layer was burning my token budget. After 190 controlled runs, the real answer is simpler and more useful: it’s not the protocol. It’s whether your MCP server has the right tool for the job.
TL;DR
- MCP’s per-task protocol overhead costs 1.2-2x more tokens than CLI tools (160 runs, GPT-4.1). Real, but not dramatic.
- The bigger cost: idle MCP servers. 7 servers eat 67K tokens — 33% of context (source) — before you type anything.
- The quality gap everyone worries about (my V1 showed 92% vs 61%) was a confound. Once I equalized tool capabilities, quality was identical: 87% vs 85%.
- MCP was actually 2.5x cheaper on one task type (code navigation chains).
- The real killer: when an MCP server is missing a key tool (like content search or log filtering), the agent either wastes tokens working around it or hallucinates.
The Setup
I used GitHub Copilot CLI’s non-interactive mode as my test harness. Its --available-tools flag lets you whitelist exactly which tools the model can use. Give it glob grep view and it acts like a CLI agent. Give it filesystem-read_text_file filesystem-search_files and it acts like an MCP agent. Same model (GPT-4.1), same prompts, same codebase.
The target was my own tesla-fleet-logger, a Go project (~1,500 lines) that ingests Tesla telemetry over MQTT into SQLite. Both arms had bash removed so the model couldn’t bypass MCP tools with cat and find.
My First Result Was Wrong
My first experiment (30 runs, 5 tasks, n=3) produced a dramatic headline: CLI tools scored 92% on factual accuracy versus MCP’s 61%. I was ready to publish.
Then a peer review caught the fatal flaw. The CLI arm had grep for content search. The MCP arm had search_files, which is a filename glob. Not the same thing at all. CLI could find every log.Fatal call across the entire codebase in one tool call. MCP had to read files one by one, hoping to spot the pattern before running out of turns.
So what was I actually measuring? Not protocol overhead. I was measuring what happens when you give one arm a power tool and the other a hand drill.
My scoring method was also biased. I checked for exact file paths in the answer. grep output naturally contains file paths. MCP answers described bugs conceptually but often missed the exact path. Same knowledge, different score.
So I threw it out and started over.
V2: 160 Runs, Fair Tools, Real Statistics
For V2, I gave the MCP arm its own content search tool (@247arjun/mcp-grep, a ripgrep wrapper). Both arms could now search file contents, list directories, and read files. The only remaining difference was the wire protocol.
I ran 20 repetitions per cell instead of 3, used LLM-as-judge scoring instead of keyword matching, and applied Mann-Whitney U tests for statistical significance. Three code analysis tasks of escalating difficulty, plus two GitHub API tasks comparing gh CLI against GitHub’s official MCP server.
Here’s what I found.
Does MCP Hurt Answer Quality?
Across 120 runs with equalized tools, CLI scored 87% and MCP scored 85% — a 2-point gap that’s statistically insignificant. The 30-point gap from V1 was entirely a confound.
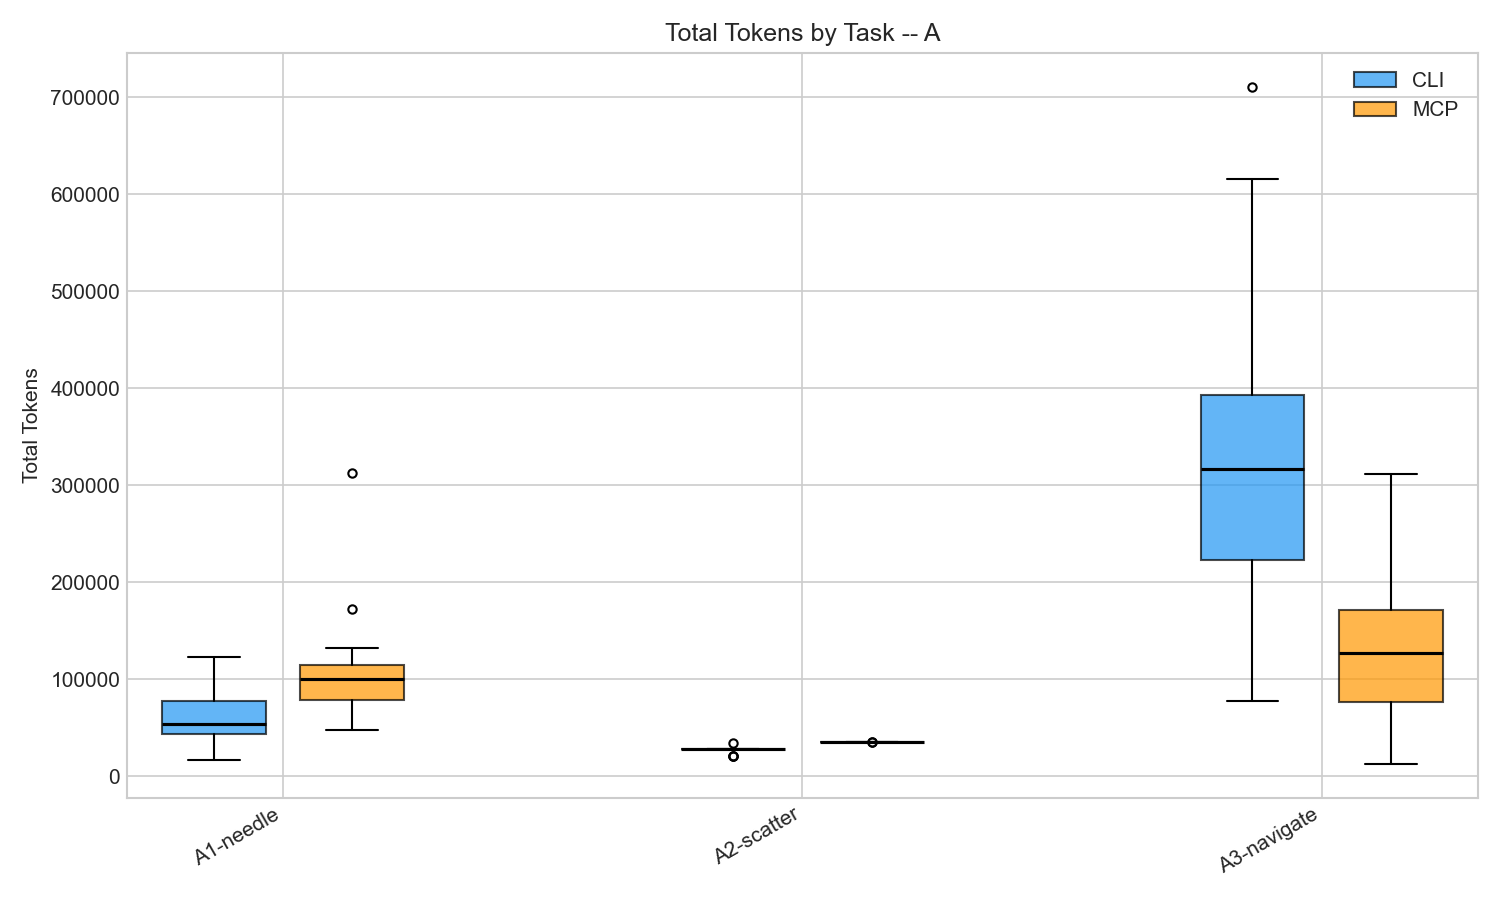 Token distribution across 20 reps per cell. All differences statistically significant (p < 0.001).
| Task | CLI Quality | MCP Quality |
|---|---|---|
| Needle in a Haystack (find a function) | 95% | 100% |
| Scatter-Gather (survey all files) | 65% | 69% |
| Code Navigation (trace data flow) | 100% | 85% |
| Overall | 87% | 85% |
In a controlled A/B test of 120 runs using GPT-4.1 with equalized tool capabilities, MCP tools scored 85% on factual accuracy versus CLI’s 87% — a gap small enough to be noise. The protocol layer itself does not degrade answer quality when the underlying tools are equivalent.
Once I gave MCP a grep tool, both arms produced equally good answers. If your MCP server has the right tools, the protocol doesn’t meaningfully hurt answer quality.
Which Protocol Costs More Tokens?
CLI used 1.2-2x fewer tokens on 4 of 5 tasks. The gap ranged from 1.2x (medium difficulty file survey) to 2.0x (GitHub CI debugging). JSON-RPC wrapping, tool definition overhead, and verbose response formats all contribute. This is real and consistent with what others have measured.
MCP’s JSON-RPC protocol costs 1.2-2x more tokens than equivalent CLI tools across most task types, based on 160 controlled runs. The overhead comes from tool definition injection, verbose JSON responses, and per-call wrapping — consistent with independent benchmarks by Reinhard (2026) and Spence (2026).
But here’s the surprise. On code navigation chains (trace a function call through three files), MCP was 2.5x cheaper. Median 127K tokens vs CLI’s 316K.
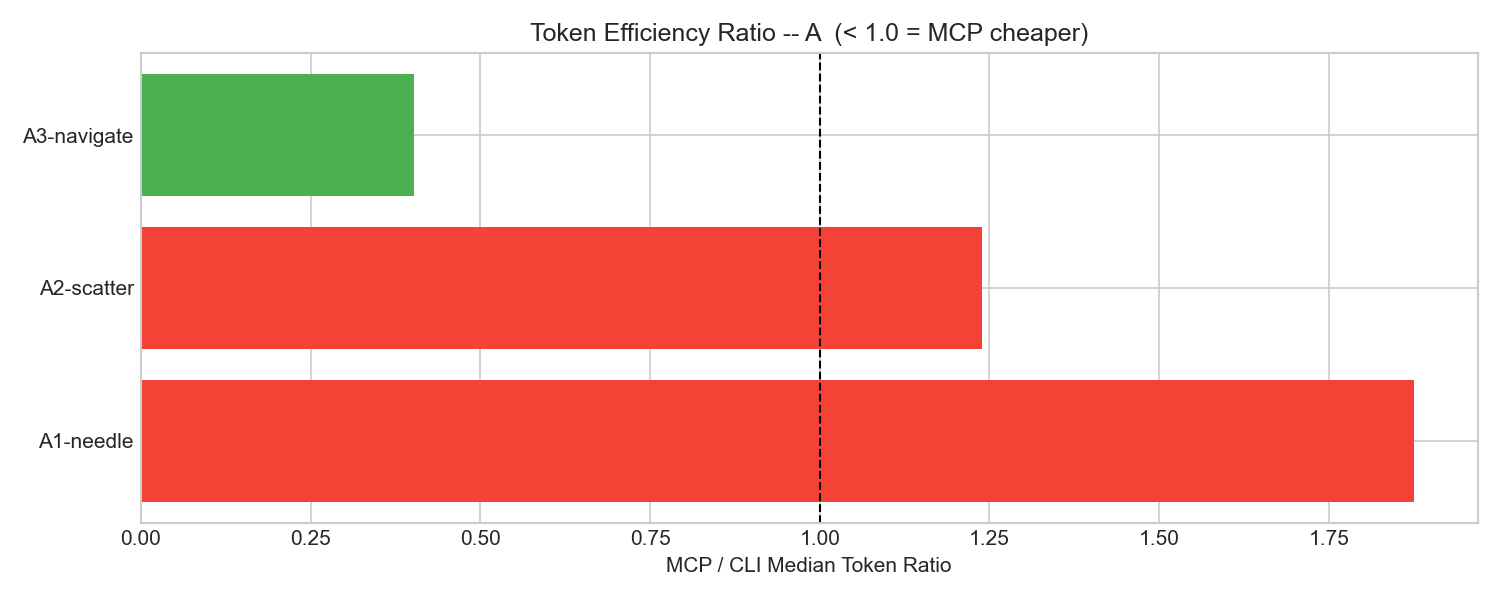 MCP/CLI token ratio. Below 1.0 means MCP was cheaper. Code navigation was the only task where MCP won.
Why would the supposedly wasteful protocol be cheaper? CLI’s grep encouraged broad, shallow exploration. The agent would grep for a symbol, get 20 matches, then read context around each one. MCP’s file-read tools encouraged targeted, deep exploration. The agent would read one file, follow a function call to another file, follow that to a third. For tracing a specific data flow, the targeted approach burned fewer tokens.
This finding won’t generalize to all codebases. On a 100K-line project, grep’s ability to search everything at once would likely win back the advantage. But it shows MCP isn’t uniformly worse.
What Do Idle MCP Servers Cost You?
Seven MCP servers consume 67,300 tokens — 33% of Claude’s 200K context window — before you type a single prompt. Every MCP server injects its full tool schema into every API call, whether you use those tools or not. In my controlled experiment with just 2 servers, that overhead was tiny (434-689 tokens). But real-world setups look very different.
| Setup | Idle Token Cost | Source |
|---|---|---|
| Playwright MCP (1 server) | ~13,600 tokens | Scott Spence |
| mcp-omnisearch (20 tools) | ~14,200 tokens | Scott Spence |
| 3 servers (filesystem, git, gateway) | ~42,600 tokens | Piotr Hajdas |
| 5 servers, 58 tools | ~55,000 tokens | Claude Code docs |
| 7 servers | ~67,300 tokens (33% of context) | Piotr Hajdas |
MCP servers inject their full tool schemas into every LLM API call regardless of whether those tools are used. With 7 servers active, 67,300 tokens (33% of a 200K context window) are consumed before the user sends a single prompt, based on measurements by Hajdas (2026).
Each additional server makes every subsequent API call more expensive, and there’s no way to “unload” a server mid-session.
What can you do about it? Claude Code now mitigates this with MCP Tool Search, which lazy-loads tool definitions on demand instead of injecting them all upfront. It activates automatically when definitions exceed 10% of context. But if you’re building your own agent harness (like I did with Copilot CLI), you need to manage this yourself. The rule is simple: only connect the MCP servers you actually need for the current task.
Finding 3: Missing Tools Still Kill MCP
GitHub MCP scored 7% on CI debugging versus CLI’s 93%. I tested gh CLI against GitHub’s MCP server on two tasks: PR summarization and CI failure debugging. PR summarization was a tie (both scored 100%). CI debugging was a disaster.
| Task | CLI Quality | MCP Quality |
|---|---|---|
| PR Summarization | 100% | 100% |
| CI Failure Debugging | 93% | 7% |
The gh CLI has gh run view --log-failed. One command, exact error message. GitHub’s MCP server has actions_list and actions_get, but nothing equivalent. The agent would fetch run metadata, try to get job logs, parse through verbose JSON. Most of the time it couldn’t find the actual error.
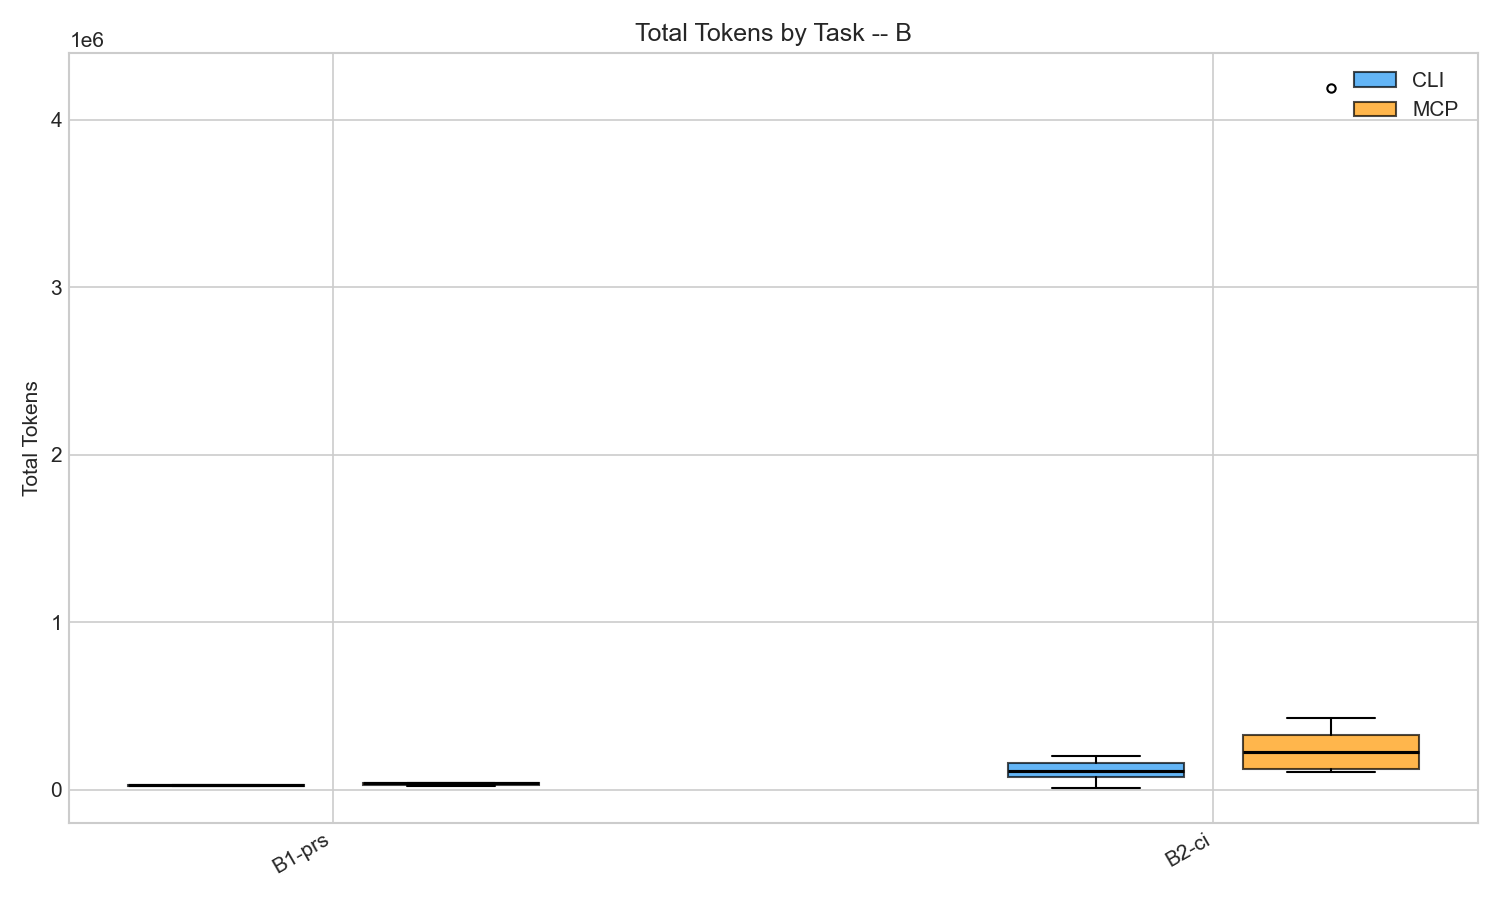 MCP variance on CI debugging was extreme: mean 616K tokens, median 226K, with some runs exceeding 1M.
Same pattern as V1, different domain. V1’s MCP arm was missing content search and scored 61%. V2’s GitHub MCP arm was missing log filtering and scored 7%. The protocol is fine. The toolset has gaps.
The Hallucination Problem
One finding didn’t need statistics. During pilot testing, I misconfigured my MCP tool names (filesystem(read_text_file) instead of filesystem-read_text_file). The model couldn’t call any tools. Did it refuse or ask for help? No — it hallucinated an entire codebase analysis. It invented file paths, package names, function signatures. The answer was confident, structured, and completely wrong.
Misconfigured MCP tools don’t throw errors. They produce hallucinations. Test your tool config.
What to Do About It
Don’t ask whether MCP is wasteful in the abstract. Ask whether your toolset exposes the right primitives for the task.
Check for content search. If you’re using @modelcontextprotocol/server-filesystem, pair it with mcp-grep or use a server that includes grep. Without content search, the agent wastes tokens reading entire files to find patterns.
Set turn limits. MCP’s per-turn overhead compounds. My worst runs (16x the median) were all unbounded exploration loops. Keep agents under 15 API requests.
Audit your MCP server’s tool coverage. Compare what gh or aws can do in one command against what your MCP server exposes. If there’s a gap (like GitHub MCP lacking --log-failed), the agent will fail or hallucinate.
Others have found similar patterns. Reinhard’s Intune benchmark saw a 35x token gap driven by tool schema injection. The Playwright MCP benchmark found MCP dumping 15K tokens of accessibility tree where CLI used 3.5K. MCP+ showed that filtering MCP outputs with a lightweight model cuts tokens by 95%. The consensus is the same: MCP overhead is real but manageable. Tool gaps are the real problem.
FAQ
Does MCP waste tokens? Yes, but modestly. MCP costs 1.2-2x more tokens per task than CLI tools due to JSON-RPC wrapping and verbose tool schemas. The bigger waste comes from idle server definitions sitting in every API call, not from the protocol itself.
Should I stop using MCP servers? No. Check your tool coverage first. If your MCP server exposes the right primitives (especially content search), quality matches CLI. The problems start when key tools are missing and the agent has to work around gaps.
How do I reduce MCP context overhead? Use Claude Code’s MCP Tool Search to lazy-load tool definitions. If you’re building your own harness, limit active MCP servers to what the current task actually needs.
All experiment code and raw data are in the mcp-vs-cli-efficiency repo.